The store will not work correctly in the case when cookies are disabled.
This website requires cookies to provide all of its features. For more information on what data is contained in the cookies, please see our Privacy Policy page. To accept cookies from this site, please click the Allow button below.
We use cookies to make your experience better.Learn more.
One thing you may have wondered about Axiom’s research is what is actually being researched from day to day. Ian Colquhoun and Andrew Welker explain the basis of that research and what they use the anechoic chamber for on a daily basis in the following video, the family of curves.
Ian Colquhoun: Today we want to talk about the ‘family of curves’, a topic we feel is not discussed often enough. It’s a topic which is extremely important to the sound of a loudspeaker – it is about what you’re actually going to hear in a room and how we determine that. As for why it’s not talked about enough, I think there are two reasons:
There’s nothing visual about it. You can’t look at a product and say “Oh, this is going to have a particular family of curves” just by what the drivers look like, the cabinet looks like, or the components on a crossover look like. None of these things really tell you much of anything about the family of curves, so we tend to gravitate and talk about things that you can see. While that’s sensible on one hand, it doesn’t really get into the meat-and-potatoes about what makes a good-sounding loudspeaker vs a not-so-good sounding loudspeaker.
The other reason it’s not talked about that much is that a family of curves is not an easy thing to measure. There are a lot of curves involved, and you really have to have an anechoic chamber in order to take all of these curves. So it’s probably not talked about in a lot of cases because it’s probably not measured.
Even just looking at a simple loudspeaker – say a 2-way bookshelf speaker – you’re looking at over 150 curves in order to create the entire family of curves that you need to work with and manipulate in order to create what’s going to be the end product. You’ve got the curves of all the individual drivers, and then you’ve got the curves of the combined end product, and that’s going to give you +150 curves. Realistically, in the process of the loudspeaker design, you’re going to be doing those over and over again (at least a certain number of them.) You can really end up in a design with over 1,000 curves before you’re done. And that’s for a simple bookshelf speaker! If you get into a multi-driver tower, you can start multiplying that number by two, three – even four times. So it’s not a particularly easy thing to do and you need the proper tools to do it.
And then once it’s all done, you still have to interpret what these curves mean. They don’t have what you would call a ‘normal’ sort of visual. If you think about on-axis or a listening window curve, we’re used to just seeing something that’s reasonably linear across the bandwidth, then that represents a good frequency response. But there’s quite a bit more to it. I’m going to turn it over to Andrew now to explain a little bit more about the family of amplitude response curves.
The family of curves
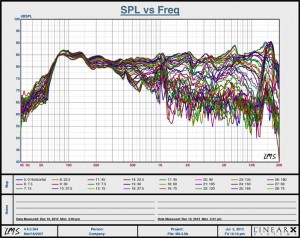
Andrew Welker: I guess the first question is “What is the family of curves?” and what we’re looking at on the screen, is a whole bunch of curves – amplitude responses – measured here in the chamber. The speaker is measured at points all the way around the cabinet horizontally and then all the way around the cabinet vertically.
One of the questions people often ask is, “Why do I care what’s coming out of the bottom of the speaker or the back of the speaker when I can’t hear that?” There is a misconception that some people have that the sound comes out of the front of the speaker and that’s all we’re worried about. Well, that would be the case if we listened to speakers inside an environment like this, where there’s no reflections. That’s what an anechoic chamber is.
But when you put the speaker in a normal room — and it doesn’t matter how much damping, or padding, or furniture, or carpet, or whatever you have in the room — you get reflections. And those reflections are not predominantly the direct signal from the speaker, it’s all of these off-axis measurements, all these positions that cause reflections coming all the way around the speaker including behind it.
Even though there’s no drivers back there, the low frequencies will have an impact behind the cabinet, the cabinet itself can radiate some sound. So we have to measure, and have an idea what the speaker is going to do in the room. The best way to evaluate that is by looking at this family of curves.
Now, this is obviously a mess, and very difficult to interpret, if you just looked at it in this method with all of these curves overlaid on one another and it doesn’t tell you a heck of a lot. And if we looked at any of the individual curves, in isolation, it also doesn’t tell you a lot.
Many people think that you need the flat on-axis response. Well, that’s nice to have, assuming that the family of curves looks smooth and even too.
Now, how we interpret this mess of curves is by looking at two main curves that we call the listening window and the sound power. The listening window takes into account the direct signal from the speaker and what are known as the “first reflection points” off of the side walls, the floor, and the ceiling. And it averages those into this upper curve that you see.
The sound power is an average of all of those curves that were on the previous page and it’s the interpretation of how you do the averaging that really is the magic of loudspeaker design. Even though companies, like us, Paradigm, PSB, Harmon, have a foundation in the NRC research that first brought to light this idea of a listening window and a sound power. It’s the way that the averaging is done is really different between all the companies. That’s why all of our speakers sound a little bit different from one another’s.
Interpreting these curves we can understand everything that the loudspeaker is doing and how it’s going to interact with the room. Small changes that we bring to individual curves may or may not impact the listening window and the sound power.
We’re always adjusting things to make these two curves look a certain way, and really, smoothness is something that we’re looking for. We don’t want big discontinuities in either the listening window or the sound power, because that will suggest that there’s an issue with the way the crossover has been designed.
M80 Listening Window and Sound Power
LFR Listening Window and Sound Power
Now listening window and sound power, this is showing a forward radiating speaker like the M80 we have the computer sitting on here. But the interpretation changes depending on how the speaker radiates sound. So, as many of you are aware, we have a speaker called the LFR1100 which is an omni-directional speaker. We call it omni-directional because it radiates energy equally in all directions. And that’s accomplished by putting drive units on the back of the speaker.
Now, you’ll see here that whereas the sound power curve and the listening window (the listening window is still on top), the shape is different. It’s different simply because the speaker is radiating sound differently than the forward radiating speaker because we have that energy from the back. Now looking at these curves you’d say well is that good or is it not, because it looks different than the other sound power curves we saw in the previous page and here’s where again it becomes a matter of interpreting exactly what these curves should be looking like.
At the end of the day, all that really matters is that you have to consider all of these family of curves in trying to assess how the speaker is going to perform in the listening room, and that’s why we actually place more importance on this family of measurements than anything else that we do in a speaker design.
Ian: On this point of the omni directional speaker, if you tried to imagine a pure omni directional speaker, where no matter where you measured the speaker, it would have exactly the same amplitude response. Then technically you would end up with a sound power listening window on axis curve that were all exactly the same curve.
Then it creates a very interesting situation where the whole idea of what the listening window should look like – reasonably linear – and then the sound power curve that is sort of dropping by 8 or 10dB across the bandwidth. All of that is sort of out the window and of course, Andrew has vast experience in designing omni-directional speakers. It makes for quite an exciting challenge.
It is an important point about listening tests as well in that really, about 80% of the listening tests that we do here, the double-blind listening tests, are about the family of curves. We will make small adjustments to the family of curves, and subject that to a listening test, to see if we can isolate measurements that can improve the sound quality.
Probably, another topic for a video is about High Q versus Low Q, things that you see in these amplitude response curves, because Low Q stuff and amplitude response curves can be quite audible, and visually, very hard to see. So, I think that probably wraps up most of what we can say about the family of curves, other than to really reiterate that it’s not a topic that you can visually see when you look at a loudspeaker.
I think that if you looked at the history of our speakers, going back to 1980, and the family of curves in the original speakers, and what we knew about the family of curves then, it’s vastly different to what is being done today because this is where we are learning things all the time. So, even an M80 say, built in the mid 90’s, sounds different than one built 3 or 4 years later, and so on and so forth, and we give them new versions and as we get enough changes together. The real change is in this family of curves and what we’ve learned about it and how we’re able to improve it, all going back to the results from blind listening tests.