OK, that was interesting. Some things I might understand, some things I don't even have a good guess about, but maybe JohnK or others can pitch in.
First step was to get some comparison graphs, including shifting graph 1 down by ~7 dB in each case, although I'm not sure that was the right amount. Comparing graph 1 vs graph 2 showed that the low frequencies were very similar, with more differences up around the crossover region.
The more I look at these graphs, the more I am starting to suspect that the second graph did NOT have the EP500 in the middle of the wall at all. Randy, is there ANY chance that both #1 and #2 were measured with the EP500 in the same position and that there is a graph #4 floating around somewhere on your hard drive ?
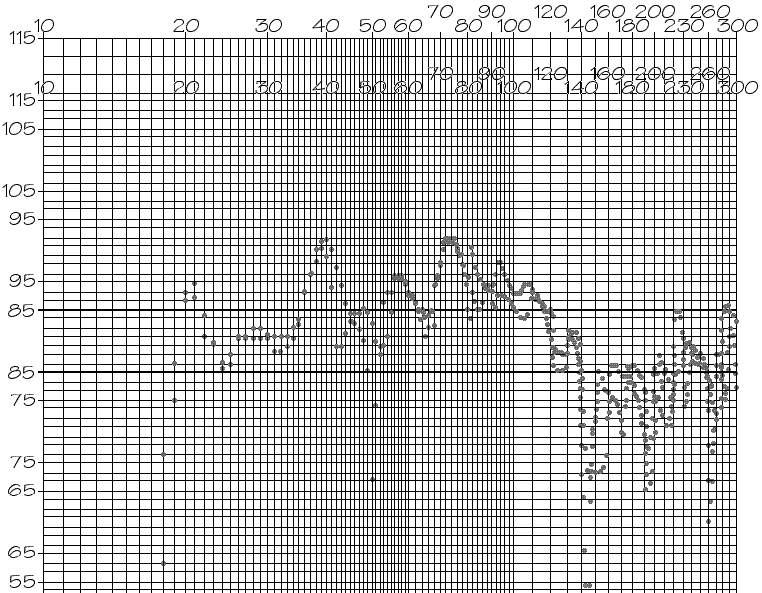
OK, now let's look at #1 vs. #3, which shows more significant differences. The most obvious difference to my eyes is that the 25-40 Hz range is significantly higher with your current layout. The graph for #3 is even bumpier than for #1 or #2, but you have "narrow dips" rather than "narrow bumps" -- my guess is that the dips are harder to hear and the results more satisfying. This all seems to make sense -- when you put the sub closer to the wall (ie on the outside of the M60 instead of inside) you will get a few dB more reinforcement at the lower frequencies.
What I don't understand so much is that graph #3 steps down above 100 Hz while graph #1 and 2 both step down closer to 120 Hz. My best guess is that this is a cancellation thing having to do with the M60s now being about 2.5 feet from the side wall as well as the back wall, but not really sure.
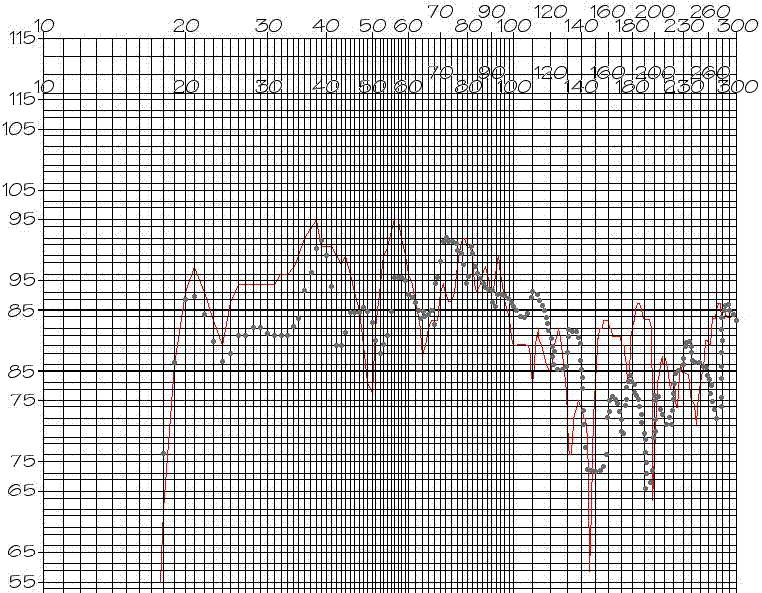
Comparing #2 and #3 doesn't really have any surprises. The difference between #1 and #2 is much less than the difference between either of those and #3. Again, I really believe the sub must have been in the same spot for #1 and #2.
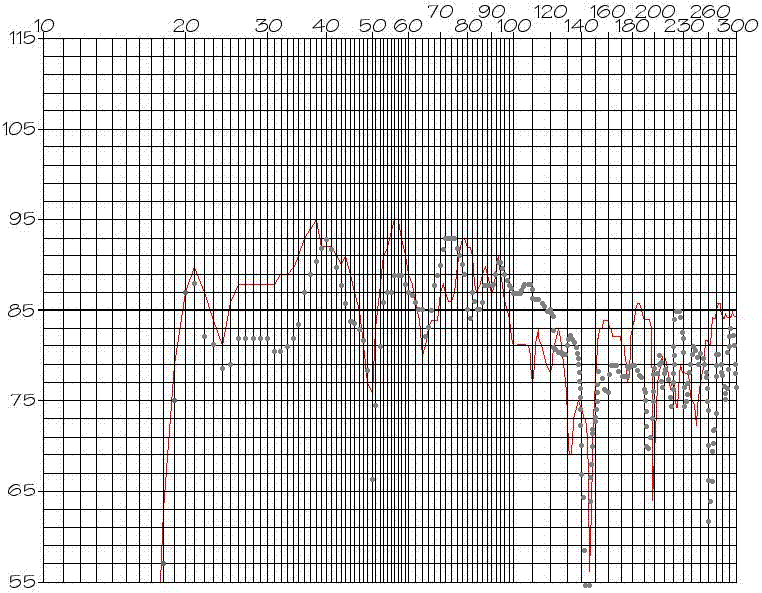
Anyways, bottom line IMO is that by putting the EP500 close to the wall you were able to bump up the 25-40 Hz range which effectively smoothed out your response. I'm not sure why it didn't make the 38-ish bump higher, only broader, but the results seem pretty good.
Please go and find graph #4, the one that REALLY has the EP500 in the middle of the wall


