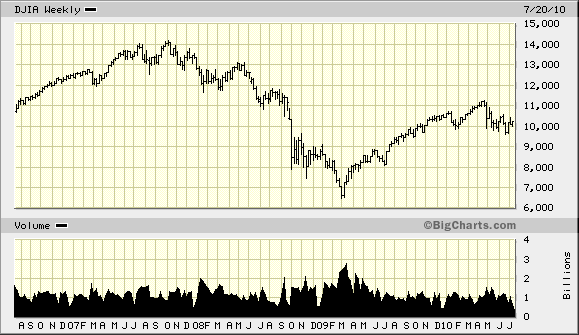
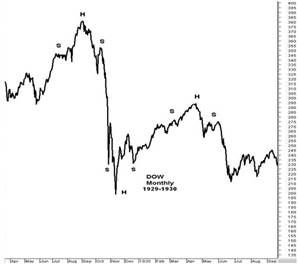
This is all I'm pointing out. Here's the 2 charts.
The first one is the Dow Jones Industrial Average from about 1929 to 1930. It made a Head and Shoulders at the high on the left, then a big drop and made an inverted Head and Shoulders at the bottom, then slowly climbed or retraced about 50% of the way back up and made another Head and Shoulders just before it dropped again to the lows made the first time.
The second chart shows the same scenerio, but is 2007 through 2010 today. Not exactly the same, but pretty close. There's no guarantee that it will continue down as it did in 1930, but it HAS followed the same pattern, so far.
Edit: Kind of like a "Dead Cat Bounce" but on a much grander scale.
DJIA 1929-1930
DJIA 2007-2010