GregBe,
Here are the pics from my testing.
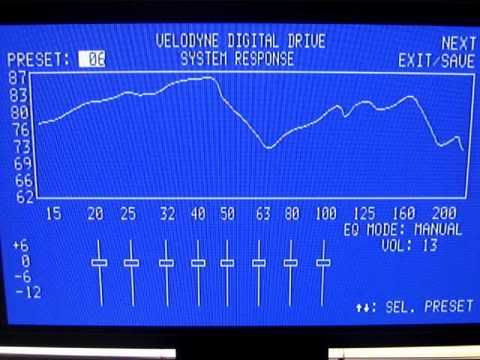
The following is my frequency response with the SMS not activated.
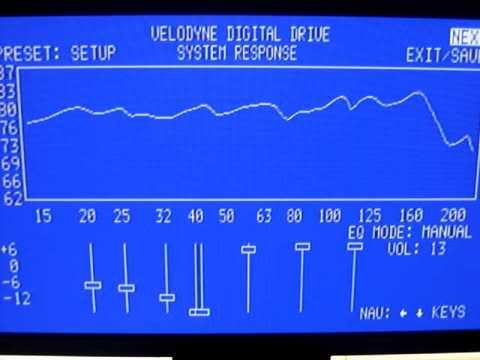
The following shows my frequency response at my normal listening levels, adjusted using the SMS filters.
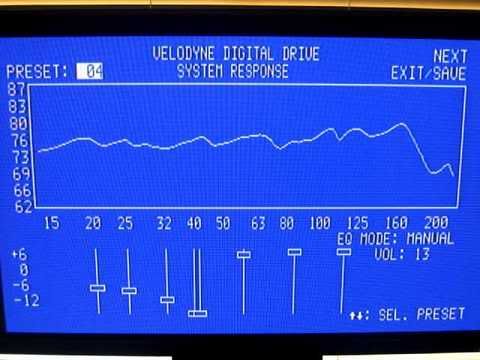
Now I decrease the volume on the receiver 10dbs below my normal listening level.
Lastly, I increase the volume on the receive 10db higher than my normal listening level.
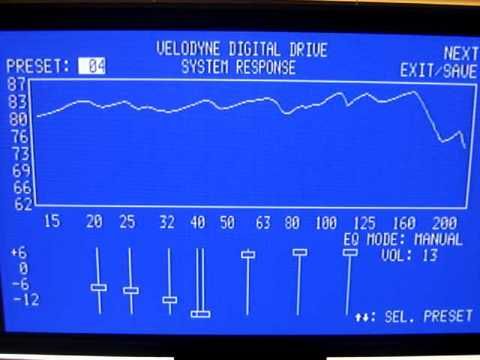
As you can see, in my room, the shape of the graph doesn't change as the volume on the receive is increased and decreased. The only change is the level of the graphs is adjusted up or down on the dB scale.
I hope this helps.
David


